

…WHENEVER WE HAVE AN OPPORTUNITY,
let us work for the good of all…
GALATIANS 6:10

…WHENEVER WE HAVE AN OPPORTUNITY,
let us work for the good of all…
GALATIANS 6:10

Mission Investment Fund in partnership

Meeting the needs of neurodiverse children and families
ABIDING HOPE LUTHERAN CHURCH
Since its beginning in 1987, Abiding Hope Lutheran Church in Littleton, Colorado, has been faithfully ministering to its neighbors. Building on its long-standing tradition of educational outreach, including its well-established preschool, the church recognized the evolving needs of its community and responded with the launch of the Nature School in 2022.

Untethered from technology, campers build community, deepen faith
LAKE WAPOGASSET LUTHERAN BIBLE CAMP
Leaving cellphones behind, more than 4,000 campers and families take part in summer camp every year at Lake Wapogasset Lutheran Bible Camp, a multisite camp and retreat center near Amery, Wisconsin. Integral to the faith-formation experience is “untangling,” the word the camp uses to describe uncoupling from electronic devices and social media.

Faithful investing, MIF’s work with Lutheran ministry organizations
GLOBAL REFUGE / LUTHERAN SERVICES IN AMERICA
At the Mission Investment Fund (MIF), we believe that financial stewardship is more than just investing—it’s about making a meaningful impact. Beyond providing secure investment opportunities for individuals and congregations, MIF serves as a trusted financial partner for ministry organizations dedicated to transformative work in communities across the country.
FIVE-YEAR SUMMARY
TOTAL ASSETS
LOANS
OUSTANDING
INVESTMENT
OBLIGATIONS
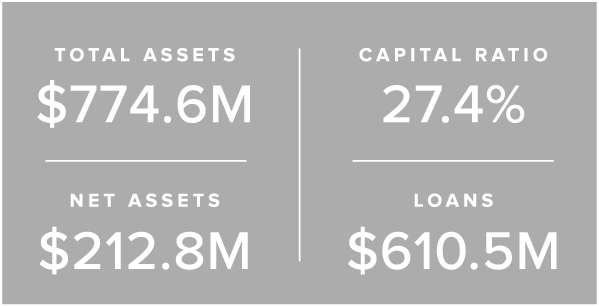
A year of transition.
A STEADFAST FINANCIAL PARTNER.
In a year of change, the Mission Investment Fund continued to be a source of resilience and stability. We closed the year at $212.8 million in total net assets. And at 27.5 percent, our capital ratio is well above regulatory requirements. Taken together, these indicators tell a story of a strong and healthy financial partner.
NET ASSETS
Equity or Net Worth
(Total Assets minus Total Liabilities)
EQUITY RATIO
Capital Adequacy
(Net Assets to Total Assets)
LOANS-TO-TOTAL-ASSETS RATIO
Key Assets/Liability
Management Measurement
DELINQUENT LOANS
TO TOTAL LOANS
Key Asset Quality Measurement
STATEMENTS OF FINANCIAL POSITIONS
$ IN THOUSANDS AS OF DECEMBER 31
| ASSETS | 2024 | 2023 | 2022 |
| Cash and Equivalents | $17,472 | $8,578 | $11,687 |
| Investments | $136,841 | $177,700 | $180,963 |
| Loans Outstanding | $610,534 | $578,270 | $582,719 |
| Less Reserve | ($6,064) | ($5,970) | ($10,157) |
| Real Estate | $2,517 | $2,638 | $2,638 |
| Other | $13,250 | $13,148 | $8,498 |
| Total Assets | $774,550 | $774,364 | $776,348 |
| LIABILITIES | 2024 | 2023 | 2022 |
| Accounts Payable | $14,282 | $18,541 | $14,044 |
| Investment Obligations | $547,491 | $547,663 | $559,372 |
| Total Liabilities | $561,773 | $566,204 | $573,416 |
| NET ASSETS | 2024 | 2023 | 2022 |
| Without Donor Restrictions | $208,667 | $204,326 | $199,431 |
| With Donor Restrictions | $4,110 | $3,834 | $3,501 |
| Total Net Assets | $212,777 | $208,160 | $202,932 |
| Total Liabilities and Net Assets | $774,550 | $774,364 | $776,348 |
STATEMENTS OF INCOME, EXPENSES, AND CHANGES IN NET ASSETS
$ IN THOUSANDS AS OF DECEMBER 31
| INTEREST | 2024 | 2023 | 2022 |
| Interest Income | $32,086 | $29,517 | $28,013 |
| Interest Expense | ($17,271) | ($12,711) | ($7,599) |
| Net Interest Income | $14,815 | $16,806 | $20,414 |
| OPERATING EXPENSES | 2024 | 2023 | 2022 |
| General Operating Expenses | $16,183 | $16,603 | $15,759 |
| Ministry Support | $2,615 | $2,892 | $2,466 |
| Provision for Credit Losses | ($166) | $1,345 | $1,128 |
| Total | $18,632 | $20,840 | $19,353 |
| OTHER OPERATING INCOME | 2024 | 2023 | 2022 |
| Other Operating Income | $260 | $328 | $268 |
| Increase in Net Assets from Operating Activities | ($3,557) | ($3,706) | $1,329 |
| NON-OPERATING INCOME (LOSS) | 2024 | 2023 | 2022 |
| Investment Return, Net | $7,770 | $9,532 | ($24,018) |
| Other | $127 | $8 | $8 |
| Change in Net Assets without Donor Restrictions | $4,340 | $5,834 | ($22,681) |
| Cumulative Change in Accounting Principle | $0 | ($939) | $0 |
| Investment Return, Net | $275 | $333 | ($737) |
| Other | $1 | $0 | $0 |
| Change in Net Assets with Donor Restrictions | $276 | $333 | ($737) |
| Change in Total Net Assets | $4,616 | $5,228 | ($23,418) |
Mission Investment Fund Products
INVESTMENTS
MIF investment products offer flexible terms and competitive interest rates. But our investments do more than simply grow your savings; they also help grow our church by providing loans to ELCA congregations and ministries.
LOANS
The Mission Investment Fund uses investors’ dollars to finance capital projects for ELCA congregations and ministries, including new buildings, additions, renovations, accessibility projects, “green” initiatives and land purchases, as well as loan refinancing. And MIF is often the only place where new ELCA congregations can obtain the financing they need. We offer competitive rates and terms, and because we are a ministry of the ELCA, we also offer a wealth of expertise in church and ministry financing that other financial institutions simply don’t have.
Leadership
MISSION INVESTMENT FUND OFFICERS
EVA M. ROBY — President and Chief Executive Officer
THE REV. LINDA O. NORMAN — Executive Vice President and Chief Financial Officer
AMELIA DAWKINS — Vice President of Lending
TIFFANY SMITH — Corporate and Compliance Counsel, Secretary
RON WINTER – Chief of Staff, Operations
MISSION INVESTMENT FUND BOARD OF TRUSTEES
PAUL OPGRANDE — Chair
THE REV. WM CHRIS BOERGER — Vice Chair
RANDALL S. FOSTER
WARREN W. HANSON
NICOLE HUDSON
KRISTA H. KAPP
JOSEPH T. NOLTE
JULIE E. SWANSON
THE REV. RUTH M. WOODLIFF-STANLEY
