



Mission Investment Fund in Partnership

Responding to the Spirit, Minnesota congregation serves neighbors with
love, dignity and respect
PRINCE OF PEACE LUTHERAN CHURCH
When members of Prince of Peace Lutheran Church in Burnsville, Minnesota, kept hearing that neighbors couldn't access eye care or glasses, the congregation responded. With a loan from MIF, they opened their Eye Clinic in June 2025. Within weeks they were able to identify and provide eye care to dozens of local children who lacked the glasses they needed to succeed and thrive at school.

Partnership shaped by purpose:
ELCA Deaconess Community and MIF
ELCA DEACONESS COMMUNITY
Rooted in a calling to service, justice and compassion, the ELCA Deaconess Community chose MIF as its primary financial partner. Sisters serve across the U.S., Canada and Puerto Rico, and the community directs grants to feeding ministries, shelters and health care worldwide—practicing financial stewardship in a way that reflects its values.

A ‘home of our own’
energizes Mara Lutheran Church
MARA LUTHERAN CHURCH
With support from an MIF loan, Mara Lutheran Church in Indianapolis purchased its first church building—a lasting home for a community largely made up of refugees from Myanmar. Welcomed into the ELCA in 2024, the congregation now has dedicated space for worship, youth ministry and welcoming the wider neighborhood.

Five-Year Summary
TOTAL ASSETS
LOANS
OUSTANDING
INVESTMENT
OBLIGATIONS
A trusted partner.
And a source of stability.
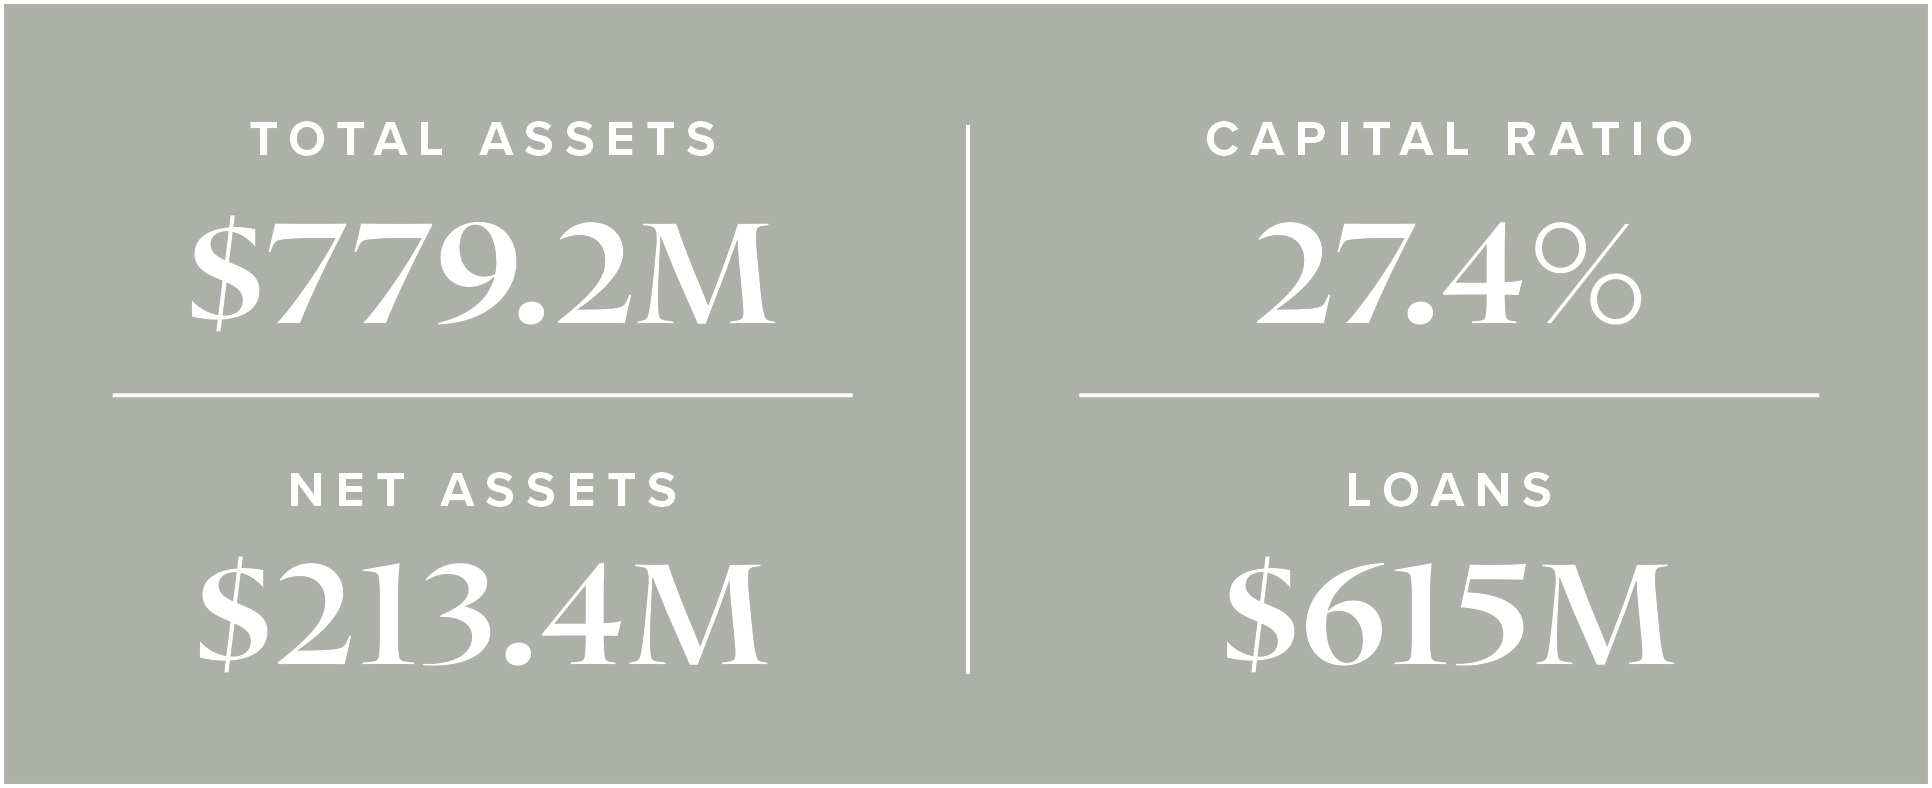
While 2025 was in many ways defined by uncertainty, the Mission Investment Fund remained the trusted partner our customers have always known us to be. We ended the year with total assets of $779.2 million and net assets of $213.4 million. Our equity ratio of 27.4 percent remained well above regulatory requirements. Thanks to our cautious, careful stewardship, we’re able to meet our obligations while continuing to support our ministries as they serve their communities.
NET ASSETS
Equity or Net Worth
(Total Assets minus Total Liabilities)
EQUITY RATIO
Capital Adequacy
(Net Assets to Total Assets)
LOANS-TO-TOTAL-ASSETS RATIO
Key Assets/Liability
Management Measurement
DELINQUENT LOANS
TO TOTAL LOANS
Key Asset Quality Measurement
Statements of Financial Positions
$ IN THOUSANDS AS OF DECEMBER 31, 2025
| ASSETS | 2025 | 2024 | 2023 |
| Cash and Equivalents | $14,692 | $17,472 | $8,578 |
| Investments | $142,482 | $136,841 | $177,700 |
| Loans Outstanding | $614,967 | $610,534 | $578,270 |
| Less Reserve | ($7,677) | ($6,064) | ($5,970) |
| Real Estate | $960 | $2,517 | $2,638 |
| Other | $13,765 | $13,250 | $13,148 |
| Total Assets | $779,189 | $774,550 | $774,364 |
| LIABILITIES | 2025 | 2024 | 2023 |
| Accounts Payable | $14,349 | $14,282 | $18,541 |
| Investment Obligations | $551,452 | $547,491 | $547,663 |
| Total Liabilities | $565,801 | $561,773 | $566,204 |
| NET ASSETS | 2025 | 2024 | 2023 |
| Without Donor Restrictions | $208,773 | $208,667 | $204,326 |
| With Donor Restrictions | $4,615 | $4,110 | $3,834 |
| Total Net Assets | $213,388 | $212,777 | $208,160 |
| Total Liabilities and Net Assets | $779,189 | $774,550 | $774,364 |
Statements of Income,
Expenses and Changes in Net Assets
$ IN THOUSANDS AS OF DECEMBER 31, 2025
| INTEREST | 2025 | 2024 | 2023 |
| Interest Income | $34,772 | $32,086 | $29,517 |
| Interest Expense | ($17,960) | ($17,271) | ($12,711) |
| Net Interest Income | $16,812 | $14,815 | $16,806 |
| OPERATING EXPENSES | 2025 | 2024 | 2023 |
| General Operating Expenses | $17,995 | $16,183 | $16,603 |
| Ministry Support | $4,382 | $2,615 | $2,892 |
| Provision for Credit Losses | $602 | ($166) | $1,345 |
| Total | $22,979 | $18,632 | $20,840 |
| OTHER OPERATING INCOME | 2025 | 2024 | 2023 |
| Other Operating Income | ($1,110) | $260 | $328 |
| Increase (Decrease) in Net Assets from Operating Activities | ($7,277) | ($3,557) | ($3,706) |
| NON-OPERATING INCOME (LOSS) | 2025 | 2024 | 2023 |
| Investment Return, Net | $7,364 | $7,770 | $9,532 |
| Other | $20 | $127 | $8 |
| Change in Net Assets without Donor Restrictions | $107 | $4,340 | $5,834 |
| Cumulative Change in Accounting Principle | $0 | $0 | ($939) |
| Investment Return, Net | $505 | $275 | $333 |
| Other | $0 | $1 | $0 |
| Change in Net Assets with Donor Restrictions | $505 | $276 | $333 |
| Change in Total Net Assets | $612 | $4,616 | $5,228 |
Mission Investment Fund Products
INVESTMENTS
MIF investment products offer flexible terms and competitive interest rates. But our investments do more than simply grow your savings; they also help grow our church by providing loans to ELCA congregations and ministries.
LOANS
The Mission Investment Fund uses investors’ dollars to finance capital projects for ELCA congregations and ministries, including new buildings, additions, renovations, accessibility projects, “green” initiatives and land purchases, as well as loan refinancing. And MIF is often the only place where new ELCA congregations can obtain the financing they need. We offer competitive rates and terms, and because we are a ministry of the ELCA, we also offer a wealth of expertise in church and ministry financing that other financial institutions simply don’t have.
Leadership
Mission Investment Fund OFFICERS
EVA M. ROBY — President and Chief Executive Officer
THE REV. LINDA O. NORMAN — Executive Vice President and Chief Financial Officer
AMELIA DAWKINS — Vice President of Lending
TIFFANY SMITH — Corporate and Compliance Counsel, Secretary
RON WINTER – Chief of Staff, Operations
Mission Investment Fund BOARD OF TRUSTEES
THE REV. WM CHRIS BOERGER — Chair
WARREN W. HANSON — Vice Chair
LIZA CANINO
RANDALL S. FOSTER
CHERRISH HOLLAND
KRISTA H. KAPP
JOSEPH T. NOLTE
MONICA R. POWERS
THE RT. REV. RUTH M. WOODLIFF-STANLEY